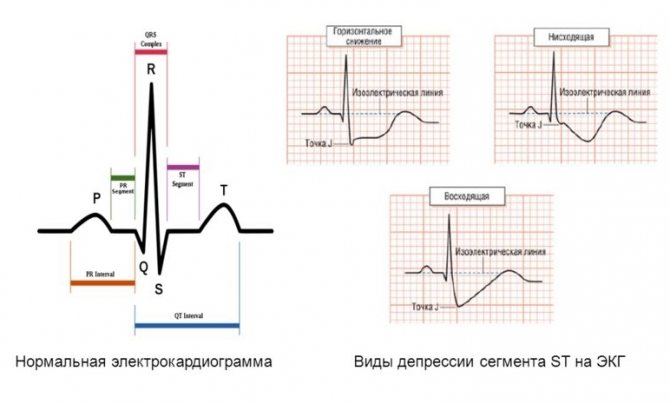
ST segment measurement rules
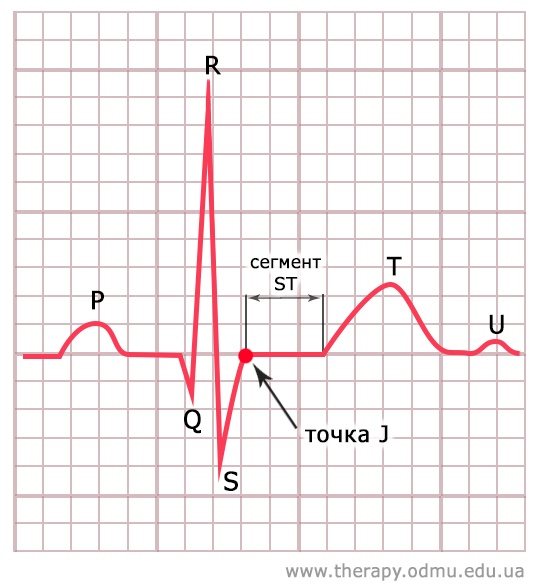
- The ST segment is measured 60 msec (one and a half small cells) from the J point.
- The J point is where the S wave transitions into the ST segment (or where the S wave crosses the isoline).
- Normally, ST elevation may be observed in leads V1-V3 with a maximum in V2 up to 0.25 mV.
- In other leads, elevation of 0.1 mV or higher is considered pathological.
ST segment elevation
ST segment elevation can take different forms depending on the cause that caused it. The most common causes of ST elevation:
- Myocardial infarction with ST elevation
- Early ventricular repolarization syndrome (EVRS)
- Pericarditis
- Post-infarction aneurysm
- Brugada syndrome
- Complete left bundle branch block (LBBB)
- Left ventricular hypertrophy
- Variant angina (Prinzmetal angina)
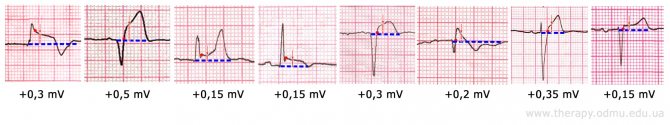
Below are examples of ST elevation in the diseases listed above. Look at each of the complexes, find the J point and calculate the height of ST elevation
60 milliseconds away. Then check the correct answer:
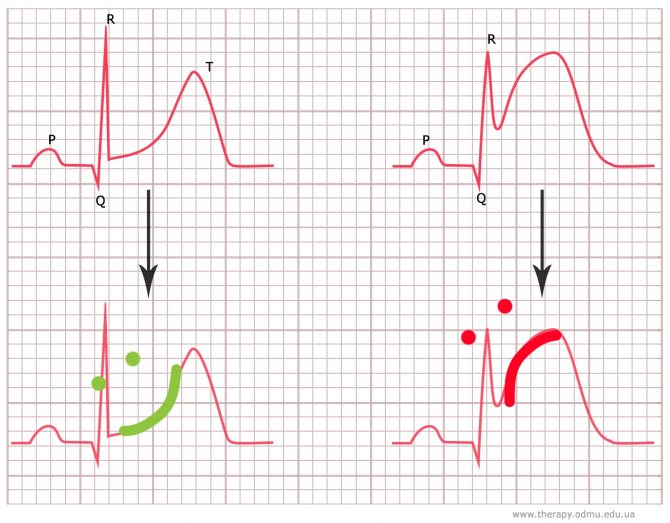
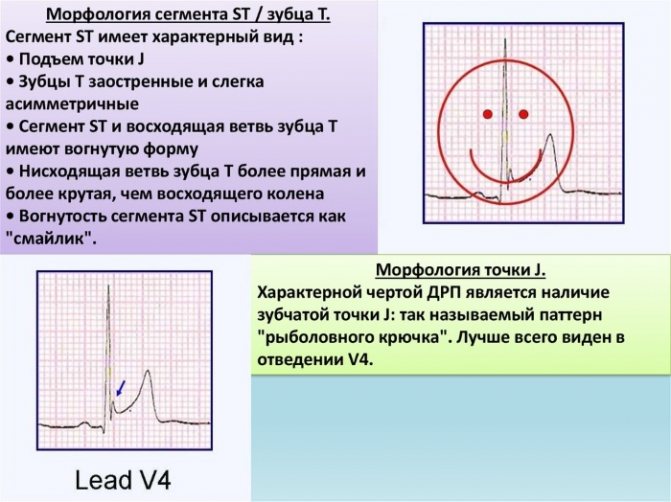
In the absence of other signs of myocardial damage (eg, Q waves or deep negative T waves), curved ST elevation is usually benign, while oblique or convex elevation is usually pathological and associated with myocardial ischemia.
There is a good “memo” for concave and convex forms of ST elevation:
ECG criteria for pathological ST elevation in STEMI
New ST elevation in two or more adjacent leads is considered pathological:
- ≥2.5 mm in V2-V3 and ≥1 mm in other leads in men under 40 years of age
- ≥2.0 mm in V2-V3 and ≥1 mm in other leads in men over 40 years of age
- ≥1.5 mm in V2-V3 and ≥1 mm in other leads in women
- ≥0.5 mm in V7-V9
- ≥0.5mm in V3R-V4R
- If the patient has a complete LBP block or a pacemaker is installed, it is necessary to use the modified Sgarbossa criteria.
- To distinguish between STEMI in the LAD and early ventricular repolarization syndrome (EVRS), use the Smith formula.
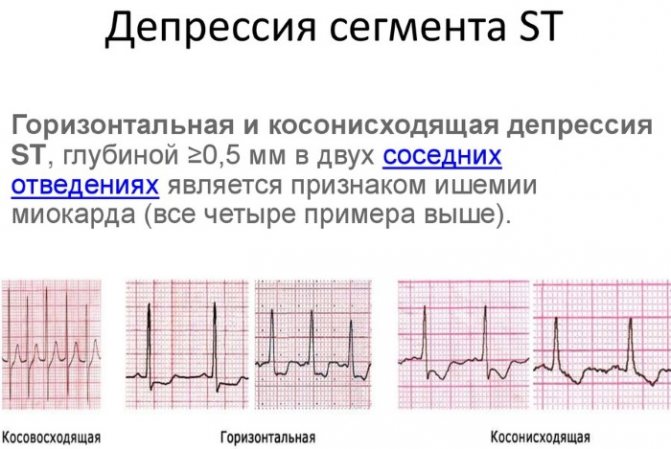
ST segment depression
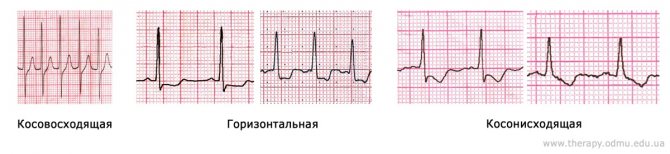
ST segment depression can be of three types:
Oblique ST depression
often occurs against the background of tachycardia (for example, during physical activity) and disappears when the heart rate decreases. Such depression is a variant of the norm. Obliquely ascending depression, turning into high-amplitude “coronary” T waves, may indicate the most acute stage of extensive myocardial infarction (the so-called De Winter’s T-waves).
Horizontal and downward ST depression
, depth ≥0.5 mm in two adjacent leads is a sign of myocardial ischemia (all four examples above).
Always note that ST depression may be reciprocal to elevation in mirror leads. Most often, acute posterior myocardial infarction is manifested by horizontal depression V1-V3 and minimal elevation in V6 (to check in such cases, it is necessary to record leads V7-V9), and high lateral infarction is manifested by ST depression in II, III, aVF and subtle elevation in aVL ( to check, you need to write down V4-V6 two intercostal spaces above).
To summarize: ST elevation and depression
- Remember that both ST elevation and depression can be normal.
- Before accepting such changes as normal, rule out all possible pathological causes.
- If you see both depression and ST elevation on the same ECG, then suspect STEMI and evaluate elevation first, as it is much more dangerous. Then analyze ST depression - it may be reciprocal changes.
When problems with the cardiovascular system begin, the most reasonable solution is to contact a cardiologist. In a hospital department, doctors can provide qualified assistance and conduct appropriate diagnostics. What happens to the heart if the electrocardiogram shows depression of the st segment on the ECG? What are the reasons for deviation from the norm? Is any therapy needed? Is there a risk to human life and health?
Normal ECG: ST segment
ST segment measurement rules
- The ST segment is measured 60 msec (one and a half small cells) from the J point.
- The J point is where the S wave transitions into the ST segment (or where the S wave crosses the isoline).
- Normally, ST elevation may be observed in leads V1-V3 with a maximum in V2 up to 0.25 mV.
- In other leads, elevation of 0.1 mV or higher is considered pathological.
ST segment elevation
ST segment elevation can take different forms depending on the cause that caused it.
The most common causes of ST elevation: Below are examples of ST elevation in the diseases listed above. Look at each of the complexes, find the J point and count the height of ST elevation 60 milliseconds from it. Then check the correct answer:
In the absence of other signs of myocardial damage (eg, Q waves or deep negative T waves), curved ST elevation is usually benign, while oblique or convex elevation is usually pathological and associated with myocardial ischemia.
There is a good “memo” for concave and convex forms of ST elevation:
ECG criteria for pathological ST elevation in STEMI
New ST elevation in two or more adjacent leads is considered pathological:
- ≥2.5 mm in V2-V3 and ≥1 mm in other leads in men under 40 years of age
- ≥2.0 mm in V2-V3 and ≥1 mm in other leads in men over 40 years of age
- ≥1.5 mm in V2-V3 and ≥1 mm in other leads in women
- ≥0.5 mm in V7-V9
- ≥0.5mm in V3R-V4R
- If the patient has a complete LBP block or a pacemaker is installed, it is necessary to use the modified Sgarbossa criteria.
- To distinguish between STEMI in the LAD and early ventricular repolarization syndrome (EVRS), use the Smith formula.
ST segment depression
ST segment depression can be of three types:
Oblique ST depression often occurs against the background of tachycardia (for example, during exercise) and disappears when the heart rate decreases. Such depression is a variant of the norm. Obliquely ascending depression turning into high-amplitude “coronary” T waves may indicate the most acute stage of extensive myocardial infarction (the so-called De Winter's T-waves).
Horizontal and downsloping ST depression ≥0.5 mm deep in two adjacent leads is a sign of myocardial ischemia (all four examples above).
Always note that ST depression may be reciprocal to elevation in mirror leads. Most often, acute posterior myocardial infarction is manifested by horizontal depression V1-V3 and minimal elevation in V6 (to check in such cases, it is necessary to record leads V7-V9), and high lateral infarction is manifested by ST depression in II, III, aVF and subtle elevation in aVL ( to check, you need to write down V4-V6 two intercostal spaces above).
Why do an ECG?
Analysis of the state of the CT segment in the electrocardiogram remains a very relevant method of modern diagnostics. Using an ECG, you can detect cardiac pathologies in the early stages and begin their therapy. Therapeutic practice shows that the treatment and prognosis of many of these diseases depend on the stage of pathology at which they are diagnosed.
Timely diagnosis of cardiac pathologies will protect against serious complications
It is possible to assess how strongly the CT segment has shifted only in combination with other cardiac parameters. Depression or elevation in itself does not necessarily indicate pathology; it may be part of the norm.
When considering the results of electrocardiography, one cannot ignore the symptoms that appear. Displacement of the CT segment may be associated with non-coronarogenic changes in the myocardium.
Important
! In rare cases, segment displacement may be a sign of acute coronary syndrome. This requires emergency medical attention.
ECG interpretation: ST segment
Take an online test (exam) on this topic.
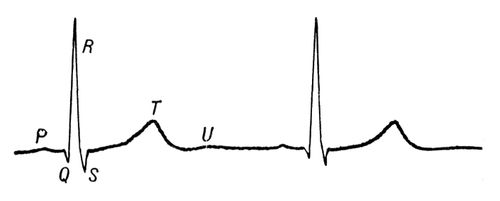
The ST segment is the segment of the ECG waveform between the end of the QRS complex and the beginning of the T wave, which corresponds to the period of the cardiac cycle when both ventricles are fully excited. The ST segment begins at point J (ST junction). On the cardiogram, the J point can be determined by the change in the slope of the vertical curve of the end of the QRS complex and its transition to a horizontal flow - the initial part of the ST segment. The ST segment ends with a transition to the T wave. The duration of the ST segment varies depending on the heart rate (the faster the rhythm, the shorter the ST segment). It is difficult to measure the exact duration of the ST segment, but this does not have a significant impact when deciphering the ECG.
Normally, the ST segment is located on an isoline. But, options are also considered normal when the ST segment is located 1.5-2 cells above the isoline (such a rise is usually combined with a high positive T wave). In rare cases, ST segment elevation can reach even 3 cells (in the presence of a deep S wave and a high positive T wave, most often recorded in chest leads V2, V3). But such a pronounced elevation of the ST segment is pathological if it has a horizontal, non-rounded shape, is convex upward, or the amplitude of the T wave slightly (1 cell) exceeds the elevation of the ST segment.
ST segment depression: causes and treatment methods
A downward displacement of the ST segment relative to the isoelectric line (depression) is a reason for a more detailed examination of the patient, since the presence of such a change allows one to suspect ischemia of the heart muscle.
It should be remembered that analysis of this segment alone in isolation from the overall picture of the electrocardiogram is not informative enough. A correct conclusion is possible only after a comprehensive detailed analysis of the recording in all leads.
A segment on a cardiogram is a section of the curve located between adjacent teeth. The ST segment is located between the negative S wave and the T wave.
The ST segment is a part of the electrocardiogram waveform that reflects the period during which both ventricles of the heart are fully involved in the excitation process.
The duration of the ST segment on the ECG depends on the heart rate and changes with it (the higher the heart rate, the shorter the duration of this section on the cardiogram).
Each section of the electrocardiographic curve has its own diagnostic value:
Element
Meaning
The same shape and size of a positive P wave and its presence before each QRS complex is an indicator of normal sinus rhythm, the source of excitation in which is localized in the atrio-sinus node. With a pathological rhythm, the P wave is modified or absent
Determined by the process of excitation of the interventricular septum (depolarization of the interventricular septum)
Reflects the excitation of the apex of the heart and the adjacent areas of the heart muscle (depolarization of the main part of the ventricular myocardium) in leads v 4, 5, 6, and in leads v1 and v2 - reflects the process of excitation of the interventricular septum
It is a reflection of the excitation of the interventricular septum adjacent to the atria (basal) (depolarization of the base of the heart). On a normal electrocardiogram it is negative, its depth and duration increase with complete blockade of the left bundle branch, as well as the anterior branch of the left bundle branch.
Is a manifestation of the processes of repolarization of the ventricular myocardium
An unstable element of the electrocardiographic curve, recorded after the T wave and appearing due to short-term hyperexcitability of the ventricular myocardium after their repolarization
The duration of this interval indicates the speed of electrical impulse transmission from the atrial myocardium to the cardiac muscle of the ventricles of the heart.
Displays the progress of the process of distribution of excitation throughout the ventricular myocardium. Lengthens with right bundle branch block
Reflects the saturation of myocardial cells with oxygen. Changes in the ST segment indicate oxygen starvation (hypoxia, ischemia) of the myocardium
Conducting electrical impulses; an increase in the duration of the segment indicates a disruption in the conduction of impulses along the atrioventricular pathway
This interval reflects the process of excitation of all parts of the ventricles of the heart; it is commonly called electrical ventricular systole. Prolongation of this interval indicates a slowdown in impulse conduction through the atrioventricular junction
On a normal cardiogram in the limb leads, the ST segment has a horizontal direction and is located on the isoelectric line. However, its position is also recognized as a variant of the norm, slightly above the isoelectric line (one and a half to two cells). This picture on the electrocardiogram is often combined with an increase in the amplitude of the positive T wave.
When analyzing an electrocardiogram, the greatest attention is paid to this segment when coronary heart disease is suspected and when diagnosing this disease, since this section of the curve is a reflection of oxygen deficiency in the heart muscle. Thus, this segment reflects the degree of myocardial ischemia.
The conclusion about ST segment depression is made when it is located below the isoelectric line.
The descent of the ST segment below the isoline (its depression) can also be recorded on the cardiogram of a healthy person; in this case, the position of the electrocardiogram curve in the ST segment does not fall below half a millimeter of the isoelectric line.
When analyzing an electrocardiogram, it is necessary to take into account that modifications of some of its elements can be caused by medications that the patient is taking, as well as deviations in the electrolyte composition of the blood.
Downward displacement of the ST segment relative to the isoelectric line is a nonspecific sign. This electrocardiographic phenomenon is observed in various leads in a number of conditions:
- Subendocardial or acute transmural ischemia (in acute myocardial infarction).
- Acute myocardial ischemia of the anterior wall of the left ventricle. This may also be indicated by ST elevation in the precordial leads.
- Acute ischemia of the lower wall.
- The result of exposure to drugs of the cardiac glycoside class.
- Hyperventilation of the lungs (excess oxygen in them).
- Reduced potassium content in the peripheral blood (hypokalemia) - in this case, there is a possibility of an additional U wave.
- Hypertrophic changes in the left ventricle, which in some cases can be interpreted as a sign of its overload.
- The horizontal displacement of this segment downwards is specific for the chronic course of coronary circulatory failure with myocardial ischemia.
- Vegetovascular dystonia.
- Pregnancy. During this period, a shift of the ST segment below the isoelectric line may be recorded against the background of tachycardia; the degree of depression in these cases does not exceed 0.5 mm.
Possibilities of Holter monitoring in detecting myocardial ischemia
Akselrod A.S., Head of the Department of Functional Diagnostics
To the Cardiology Clinic of MMA named after. THEM. Sechenov
Today, the screening method for detecting myocardial ischemia is still the stress ECG test.
However, one can find conflicting publications about the capabilities of Holter monitoring in the diagnosis of coronary artery disease, with most authors pointing to the low (from 10 to 50%) sensitivity of this method.
Therefore, discussion of the place of Holter monitoring in the algorithm for verifying coronary artery disease seems to be a relevant topic in practical cardiology.
Advantages and disadvantages of Holter monitoring compared to stress testing.
In the publications mentioned above, most authors use two- and three-channel 24-hour ECG recorders. Of course, the sensitivity of the method will be much higher when using a twelve-channel recorder, although, of course, none of the Holter recorders can replace the stress test as a screening method.
These two research methods have one thing in common: ECG dynamics over time. In all other respects they are fundamentally different. At the same time, Holter monitoring has three fundamental disadvantages compared to stress testing:
- during Holter monitoring, the patient himself chooses the load mode, so submaximal heart rate is often not achieved;
- the load is not of a continuously increasing nature;
- the loading regime cannot be immediately controlled by a doctor (only retrospective analysis is possible).
However, Holter monitoring has a number of advantages in detecting myocardial ischemia both compared to standard resting ECG and compared to stress tests. These benefits include:
- the possibility of natural modeling (by collecting anamnesis, you can simulate almost any situation typical for a patient that provokes an ischemic attack);
- the ability to establish a clear cause-and-effect relationship between the attack and the conditions of its occurrence (the diary is used to compare the patient’s activity with the time of the onset and end of the ischemic episode);
- detection of silent myocardial ischemia, especially at night;
- assessment of the effectiveness of antianginal therapy depending on the time of day and the possibility of more precise therapeutic correction taking into account other changes (for example, rhythm disturbances and cardiac conduction).
Myocardial ischemia is a situation of insufficient blood supply to the myocardium with two different outcomes: subsequent restoration of metabolism in cardiomyocytes (a disturbance in the repolarization process occurs and the dynamics of the T wave is recorded) or the progressive development of damage to muscle fibers (manifested by certain forms of ST segment displacement above or below the isoline). With further deterioration of the blood supply to the heart, irreversible damage to a larger number of myocardiocytes occurs, the development of inflammation and necrosis. In this case, pronounced dynamics of the ST segment and a change in the QRS complex are noted.
During Holter monitoring, you can clearly see the first two outcomes of coronary insufficiency, which will be discussed in this lecture.
Variants of ischemic and non-ischemic ST-T dynamics.
Not all dynamics of ST-T (the terminal part of the ventricular complex) should be regarded as ischemic. There are the most typical variants of ischemic changes in the T wave and ST segment in the monitor leads, as well as stereotypical conditions with which episodes of myocardial ischemia have to be differentiated.
Dynamics of the T wave
With myocardial ischemia, depending on the affected area (subendocardial or subepicardial), different T waves are recorded: tall, pointed, flattened or inverted (negative).
The leading significance in the diagnosis of ischemia is not the background nature of these changes, but their dynamics over the entire recording period.
In this case, the most difficult circumstance is that all three described forms of the T wave can be positional
. Especially often, such dynamics of the T wave are recorded at night.
In doubtful cases, it makes sense to make test registrations in different body positions: standing, lying on the right and left side, lying on the back, lying on the stomach.
Apart from the clinical picture, changes in the T wave when recording a resting ECG are not specific for coronary heart disease. For example, a tall, pointed T wave
(Fig. 1) should be differentiated from the syndrome of early ventricular repolarization, hyperkalemia, manifestations of alcoholic cardiomyopathy, and vagotonia.
Rice.
1. Patient K., 54 years old: at the time of Holter monitoring, the level of K+ in the blood was 5.35 mEq/L (normally up to 4.7 mEq/L).
When identifying negative or smoothed T waves
it is necessary to differentiate myocardial ischemia from other situations, for example:
- variants of a normal ECG in children and adolescents;
- “athletic heart” (ECG changes due to intense physical activity, currently or in the past);
- hyperventilation;
- manifestations of pericarditis, myocarditis (negative T waves in most or all leads);
- arrhythmogenic dysplasia of the right ventricle (a negative T wave is more often recorded in leads V1-V2);
- cerebrovascular accident (deep negative T waves with a wide base);
- carbon monoxide intoxication;
- typocalemia.
It is the correspondence in time of T wave inversion to a typical pain attack according to the diary (pressing pain in the heart area) that makes the ischemic nature of T wave inversion most likely (Fig. 2).
Fig. 2. Patient G., 63 years old: the appearance of T wave inversion when climbing stairs
(corresponds to the note in the diary “pressing pain in the chest”).
| A – ECG at rest (reading a book) | B – ECG when climbing stairs |
Dynamics of the ST segment
When performing automatic analysis of 24-hour ECG monitoring data, a curve of time dispersion of the ST segment is generated in relation to the isoline. This curve is called the ST trend
.
In this case, it is ideal for the doctor to be able to place the ST trend next to it with a table of absolute values of the dynamics, the heart rate trend and the corresponding ECG fragment.
When selecting a fragment of a trend that is suspicious for ischemic depression of the ST segment, the doctor “wanders” the cursor along the trend and compares various ECG fragments with each other.
It is imperative to review all episodes of elevation and depression of the ST segment of at least 1 mm (we, for our part, strongly advise checking all fragments of the trend that are close in absolute value to 1 mm). This version of the software operation is, without a doubt, the most convenient for work (Fig. 3).
Fig.3. Working window of the program: ST trend with a table of absolute values, HR trend and the ECG fragment corresponding to the cursor.
All “suspicious” fragments are necessarily compared with the patient’s diary entries in the “Well-being” column, and are also displayed in the “ECG Review” window (Fig. 4).
It is the analysis of the complete ECG registration that makes it possible to see the beginning and end of ischemic changes.
In this case, the software must make it possible to display on the screen any of the channels or all (at your request) of the channels in which monitoring was carried out.
Fig.4. “ECG review” window – displaying an ECG fragment suspicious for ischemic dynamics.
Diagnostically significant and most specific is stable horizontal (Fig. 5A) or oblique (Fig. 5B) depression of the ST segment within the same lead.
Fig.5. The most specific dynamics of the ST segment: A - stable horizontal depression, B - oblique depression.
A
B
Rapid obliquely ascending depression of the ST segment against the background of sinus tachycardia is also not highly specific and is physiological in nature. Slow obliquely ascending and unstable horizontal depression of the ST segment in combination with a typical clinical picture is extremely suspicious for myocardial ischemia (Fig. 6).
Fig.6.
Slow oblique and unstable horizontal depression of the ST segment.
In this case, it is especially important to compare the nature of the ST segment at rest and during exercise during the day: it is the dynamics of the segment from the isoline that is most indicative. Therefore, in the printout of significant ECG fragments in the final conclusion, the fragment where the ST segment is located on the isoline must find its place (Fig. 7).
Rice. 7. The same patient: fragment of registration at night (ST segment is on the isoline).
Often in the same patient one can see different morphological variants of ST segment depression within a day, while the clinical manifestations of ischemia may be absolutely the same or absent.
It is also worth remembering that if there is underlying depression during monitoring, the specificity of ST segment dynamics is reduced.
The complexity of the analysis is always created by artifacts, “crosstalk” and “drift” of the isoline during the natural movements of the patient. In this case, a decrease in recording quality is detected when the patient is most physically active, i.e. just at the time when ischemic episodes are most likely to be recorded.
When using Holter monitoring, much attention is paid to the diagnosis of silent (painless) myocardial ischemia, as well as episodes of nocturnal angina.
It is the patient’s complaints of pain in the heart area (discomfort, feeling of lack of air) at night that are an indication for daily ECG monitoring in order to exclude myocardial ischemia.
It must be remembered that, having the ability to analyze the ECG in only 2-3 leads (most recorders), it is practically impossible to determine the topic of detected changes.
Therefore, for these categories of patients, it would be preferable to use twelve-channel 24-hour ECG recorders, especially in cases when it comes to the need for coronary angiography in the near future. It is in such a situation that Holter monitoring allows one to speak in favor of emergency coronary angiography without performing a stress test.
When working with software, the ability to select the voltage of the ECG signal is of great importance. Figure 8 shows the same recording fragment with different voltages, which creates different viewing experiences.
Rice. 8. Choice of voltage and absolute value of ST segment depression in the same fragment of Holter recording: A - maximum voltage, B - minimum voltage.
| A | B |
As with the analysis of a standard resting ECG, the analysis of ischemic changes is significantly more difficult with blockade of intraventricular conduction, severe myocardial hypertrophy, etc.
In addition, I would also like to recall the fairly frequent cases of false-positive diagnosis of coronary artery disease in patients with severe anemia, as well as in women taking estrogen or in premenopause with background ST segment depression.
Every practicing physician often encounters such patients.
Detection of the dynamics of the ST segment in such patients requires a mandatory full additional examination (stress treadmill test or bicycle ergometry, myocardial perfusion scintigraphy, stress echocardiography).
In conclusion, I would like to once again emphasize the place of Holter monitoring in the algorithm for diagnosing IHD. This method, of course, is not a screening method for diagnosing coronary artery disease. However, the value of daily ECG recording in detecting myocardial ischemia is undeniable in some categories of patients.
It is Holter monitoring that is the method of choice for those patients for whom a stress test is contraindicated (the first three days after a major myocardial infarction to exclude early post-infarction angina) or for patients who require special conditions for reproducing coronary insufficiency (nocturnal silent myocardial ischemia, vasospastic angina).
Often, it is the use of this method that allows us to develop the correct strategy for the further management of severe patients.
Moscow, 05/19/2009
Source: https://www.schiller.ru/profile/articles/halter/141/
What is the ST segment?
The ST segment is one of the sections of the electrocardiogram - a recording on which the electrical impulses of the heart are recorded. The work of this organ is regulated with the help of a pacemaker in the sinus node, which produces 60-90 impulses every minute.
The latter cover various areas of the heart muscle (myocardium) with excitation and are recorded on paper tape in the form of an ECG curve.
The segment of the graph, marked with the Latin letters ST, displays the part of the heart cycle when slow repolarization of the ventricles occurs, that is, their relaxation before subsequent contraction. Cardiac muscle cells cannot remain excited for a long time.
The leading role in the processes of extinction of myocardial activity is played by the coordinated work of the potassium-sodium pump, the return of sodium ions to their original state. Since electrical activity is low during this period, the ST segment should normally be in a straight line between two adjacent teeth.
Its duration (length on the graph) depends on the heart rate; the higher it is, the shorter the segment. The exact duration is difficult to measure and has little clinical significance.
What are nonspecific ST-T changes on an ECG?
Nonspecific ST-T changes on the ECG can occur with various disorders - from infectious diseases to myocardial infarction. This ECG parameter is sensitive to the influence of many factors, that is, it cannot serve as the only diagnostic criterion for a certain pathology. Therefore, its changes are called nonspecific.
They do not have much diagnostic value, but their occurrence requires additional research, since in combination with other characteristics they can indicate serious diseases that lead to serious complications.
As mentioned above, this section should be on an isoline.
However, its deviation is allowed in the following cases:
- a decrease of 0.5 mm, especially if the T wave, reflecting the ability of the myocardium to hold the electrical potential, is characterized by a small amplitude or it is negative, that is, the phenomenon of inversion is observed (inversion relative to the isoline);
- an increase of 1.5-2 mm with a high positive T wave, while the segment has a concave shape;
- ST elevation up to 3-3.5 mm with a deep S wave and a high positive T wave. Its elevation occurs in this case gradually, that is, the segment actually turns into a T wave.
Sometimes doctors mistake these variants of the norm for deviations and make an incorrect diagnosis.
Heart ST depression
Depression of the ST segment, or its decrease relative to the isoline by more than 1 mm, is a clinically significant sign. Such a change can be caused by both nonspecific and specific reasons, which are discussed below.
Non-cardiac and physiological causes include:
- errors on the part of medical staff when taking an ECG - incorrect application of electrodes or their poor contact with the patient’s skin;
- water and electrolyte disturbances that occur when drinking sea water in large quantities, dehydration, alcohol abuse, salt-free diet, anorexia, heavy physical activity, use of diuretics, as well as certain pathologies (diseases of the kidneys, gastrointestinal tract, thyroid gland, burns, significant blood loss);
- drinking very cold water;
- hyperventilation (increased air exchange in the human body).
What does ECG mean in decoding?
Nonspecific ST-T changes on the ECG in the form of its decrease relative to the isoelectric line are primarily associated with cardiac ischemia, as the most dangerous condition that can lead to death.
However, this change is nonspecific and can also occur with other disorders of the heart. To correctly interpret this deviation, differential diagnosis is necessary.
Why is the ST segment reduced in adults and children?
A decrease in the ST area on the ECG in adults and children can occur in the following cases:
Causes of cardiac changes
Myocardial infarction and other serious cardiovascular pathologies do not develop overnight. Perhaps the person neglected the alarming symptoms for some time, or did not follow the recommendations of the attending physician. Some did not take such a diagnosis as coronary artery disease seriously, underestimating the risks of the pathology.
Abnormalities in electrocardiogram results may appear for various reasons. Most often, this study provides a reliable picture of the work of the heart muscle. Although errors do occur, they are very rare.
Important
! ST segment depression symptoms sometimes appear even in healthy people. If, in addition to changes in the ECG, there are no negative symptoms, we can talk about the physiological norm. Although periodic visits to a cardiologist and monitoring of heart condition should not be neglected.
Deviations from the norm in the electrocardiogram picture may appear if the procedure is performed incorrectly. This situation is possible if the electrodes are applied incorrectly. In this case, there is not enough contact, and the device records unreliable data.
Other non-cardiac causes of ECG abnormalities:
- electrolyte disturbances;
- hyperventilation;
- abuse of medications, including narcotic drugs;
- frequent drinking of alcohol;
- drinking cold water.
The development of any pathology can be stopped subject to timely diagnosis and proper treatment. To do this, if the slightest unpleasant symptoms appear in the heart area, it is recommended to visit a therapist to get a referral for examination. This way you can prevent the development of serious and dangerous pathologies.